1. License
This work is licensed under the Creative Commons Attribution-ShareAlike 4.0 International License. To view a copy of this license, visit http://creativecommons.org/licenses/by-sa/4.0/ or send a letter to Creative Commons, PO Box 1866, Mountain View, CA 94042, USA.
2. Overview
PulseView is a graphical frontend for the libsigrok and libsigrokdecode libraries, permitting access to a wide range of devices and protocol decoders to let you record, analyze, process and export analog and logic data. It is part of the sigrok suite, just like the libraries that it makes use of.
The sigrok suite needs some kind of hardware to interface to the signals you want to examine. We found that most people are currently using logic analyzers based on the Cypress FX2 microcontroller. With fx2lafw, sigrok’s open source runtime firmware, any device containing an FX2 can become a powerful streaming logic analyzer. A variety of compatible low cost chinese made logic analyzer products are available for as little as $5. These can easily be found by searching for 24MHz Logic Analyzer. There are also barebone Cypress FX2 boards such as the Lcsoft Mini Board, which can usually be found by searching for Cypress FX2 Board or similar.
In addition, a good set of quality probe hooks is recommended.
Aside from FX2-based logic analyzers, sigrok also supports FX2-based oscilloscopes such as the Hantek 6022BE, non-FX2 devices like the Openbench Logic Sniffer or devices that make use of the SCPI protocol, as all reasonably modern oscilloscopes do (Rigol DS1054z, LeCroy WaveRunner, Yokogawa DLM and similar).
Please be aware however, that PulseView currently only supports devices that can either work as an oscilloscope, a logic analyzer or a mixed-signal device. This means that multimeters in particular are currently only usable with either sigrok-cli or sigrok-meter.
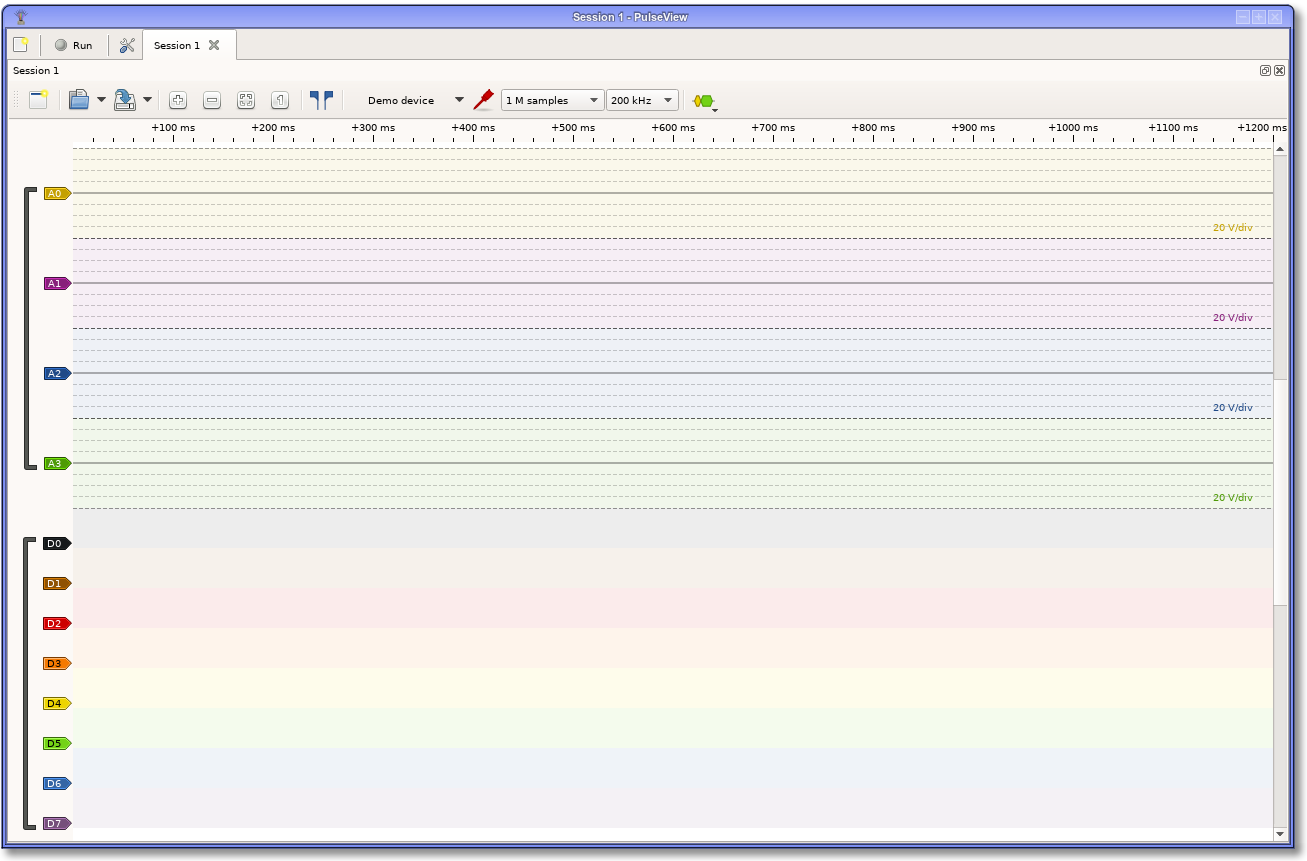
The PulseView user interface is geared towards navigation and analysis of captured waveforms, so the most space is by default used up by the main trace view. From here, you can access the most often used features.
Before we dive deeper into how to accomplish things, let’s make PulseView available on your system first.
3. Installation
PulseView can be run on Linux, Windows, Mac OS X or Android. For some platforms, we provide binary packages, for others we provide installers and for others we provide AppImage containers that you can run without the need to install anything. Check the sigrok download page to see which option is available for your platform.
3.1. Linux
On Linux, the usual way to install PulseView is to install the packages provided by your distro’s package manager. However, sometimes only outdated packages are made available to you. In that case, you have two options:
-
Download and use the AppImage which contains all required files and needs no installation:
chmod u+x PulseView-NIGHTLY-x86_64.AppImage
./PulseView-NIGHTLY-x86_64.AppImage
Please be aware, however, that the AppImages are built every night, so they always contain the latest development changes. While we do try to keep the code base in a working state, it is sometimes unavoidable to introduce bugs that show up in the nightly builds. If you encounter something that is odd to you, please download and install the latest nightly and check if the issue still exists. If it does, feel free to file a bug.
No system files are changed, so if you decide that you no longer want to use PulseView, simply delete the AppImage. If you also want the stored settings gone, delete ~/.config/sigrok as well.
-
Uninstall any sigrok packages from your package manager and build PulseView from source:
[install dependencies as listed on the wiki]
mkdir ~/sr
cd ~/sr
wget -O sigrok-cross-linux "https://sigrok.org/gitweb/?p=sigrok-util.git;a=blob_plain;f=cross-compile/linux/sigrok-cross-linux"
chmod u+x sigrok-cross-linux
./sigrok-cross-linux
export LD_LIBRARY_PATH=~/sr/lib
~/sr/bin/pulseview
No system files are changed, so if you decide that you no longer want to use PulseView, simply delete the ~/sr directory. If you also want the stored settings gone, delete ~/.config/sigrok as well.
|
If you don’t install the PulseView distro packages (as is the case when using the AppImage or building from source), PulseView will not be able to access USB and serial port devices unless it’s run as root. Since programs shouldn’t be run as root unless absolutely necessary, we provide udev configuration files that allows PulseView access to those devices without being root. Here’s how you install them: sudo bash cd /etc/udev/rules.d/ wget -O 60-libsigrok.rules "https://sigrok.org/gitweb/?p=libsigrok.git;a=blob_plain;f=contrib/60-libsigrok.rules" wget -O 61-libsigrok-plugdev.rules "https://sigrok.org/gitweb/?p=libsigrok.git;a=blob_plain;f=contrib/61-libsigrok-plugdev.rules" wget -O 61-libsigrok-uaccess.rules "https://sigrok.org/gitweb/?p=libsigrok.git;a=blob_plain;f=contrib/61-libsigrok-uaccess.rules" sudo udevadm control --reload-rules |
3.2. Windows
We offer installers for PulseView that contain everything you need to get started. Simply download them from the sigrok download page and run them as any other Windows installer. Please be aware, however, that the Windows installers are built every night, so they always contain the latest development changes. While we do try to keep the code base in a working state, it is sometimes unavoidable to introduce bugs that show up in the nightly builds. If you encounter something that is odd to you, please download and install the latest nightly and check if the issue still exists. If it does, feel free to file a bug.
After installation, you will find a program called Zadig in the start menu. By default, certain devices recognized by Windows will have drivers installed for them that PulseView cannot use. The purpose of Zadig is to let you change the driver Windows uses for a particular device - for most devices you’ll need to choose WinUSB to use them with PulseView or the original proprietary Windows driver to use it with whatever other software you access the device with. More details are available in the wiki.
In case your device doesn’t show up in PulseView and you can’t find it with a scan either (see next chapter), check with Zadig whether the correct driver is assigned for the device.
3.3. Mac OS X
We offer DMG installers for PulseView that contain everything you need to get started. Simply download them from the sigrok download page and run them.
Please be aware, however, that the DMG installers are built every night, so they always contain the latest development changes. While we do try to keep the code base in a working state, it is sometimes unavoidable to introduce bugs that show up in the nightly builds. If you encounter something that is odd to you, please download and install the latest nightly and check if the issue still exists. If it does, feel free to file a bug.
No system files are changed, so if you decide that you no longer want to use PulseView, simply delete the DMG file. If you also want the stored settings gone, delete ~/Library/Preferences/pulseview.plist as well.
4. Data Acquisition
Working with PulseView follows a pattern:
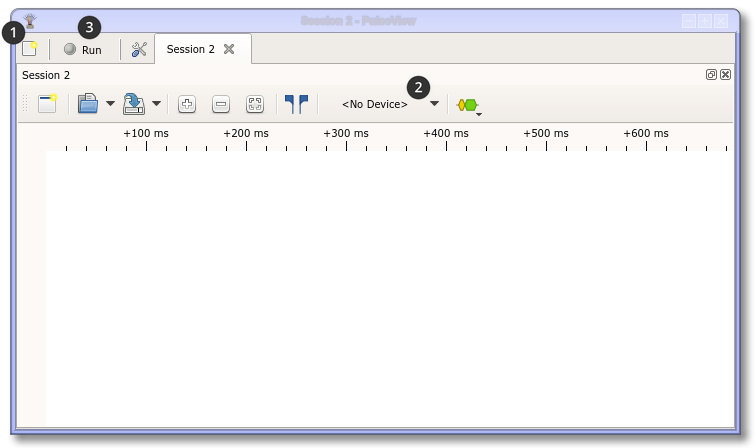
| 1 | Open a new session |
| 2 | Select the device you want to work with: |
| 3 | Click "Run" to acquire signal data (waiting for a trigger first if you set one) |
When you start PulseView and no sessions are restored from the last time you used it, it will come up with a session that has the demo device selected. That way, you can get to know the program even when you don’t have any hardware to use it with.
4.1. Device Selection
The device selector offers two methods to choose the device to use. If you click on the small arrow on the side, you see a list of devices PulseView has recognized. If the device you want to use it listed, you can just select it here to use it.
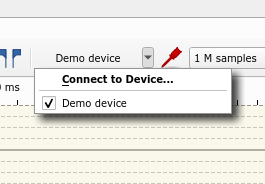
If it’s not listed, you’ll need to scan for it first. Since most serial port and Ethernet devices can’t be auto-detected, this is usually required for those. To do so, either choose the "Connect to Device" option from the list or click on the button itself. You will see the following dialog:
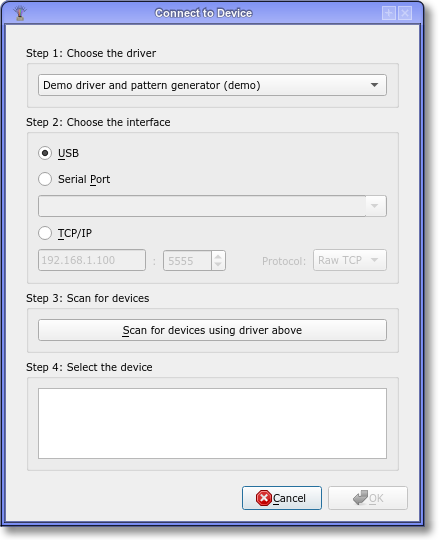
First, you’ll need to pick a driver that you want to use. In order to do this, you’ll need to know which driver is used to talk to the device. If you’re unsure, you can either try the driver which you think may fit best or you can check the wiki. For every supported device there’s a wiki page, showing you which driver is used.
Once the driver has been chosen, you need to select the interface. Please be aware that USB is only usable for devices that directly communicate over USB. Devices that use USB to emulate a serial port (like the OpenBench Logic Sniffer) will have their serial port listed in the serial port drop-down.
In case your device connects via Ethernet, you must supply the IP address and port. You are also given the option to choose between raw TCP access and using the VXI protocol. VXI is an industry standard which is mainly used in professional equipment and the device will most likely let you know that it supports VXI. If your device however is more of a hobbyist grade device, it’s more likely that using raw TCP will be the correct choice.
After you selected the appropriate options, clicking the scan button will make PulseView try to connect to the device with the given settings. If successful, any device(s) found will be shown in the list box.
| When a session uses a USB device and you close Pulseview, a session with that same device is re-opened when you start Pulseview again. Currently, this is however not the case for non-USB devices, such as ones that connect via serial port or Ethernet. |
| To avoid having to manually enter the device configuration for a serial port or Ethernet device every time you want to use it and then having to scan for it, you can also use the command line parameter -d to have PulseView scan for it on startup. |
You may then change the device configuration and/or start the data acquisition by clicking the "Run" button on the top left.
When you run the acquisition, you’ll notice that the newly captured data goes off-screen. This is to improve performance and let PulseView acquire the data without bogging down your CPU too much. If you find this inconvenient because you’d like to see what kind of data is coming in, you have three options:
-
Enable "always perform zoom-to-fit" temporarily (see chapter "Data Analysis")
-
Enable "constantly perform zoom-to-fit during acquisition" in the options
-
Enable "always keep newest samples at the right edge during capture" in the options
Which method suits you best is up for you to decide.
4.2. Device Configuration
In PulseView, the device configuration is done using these buttons:
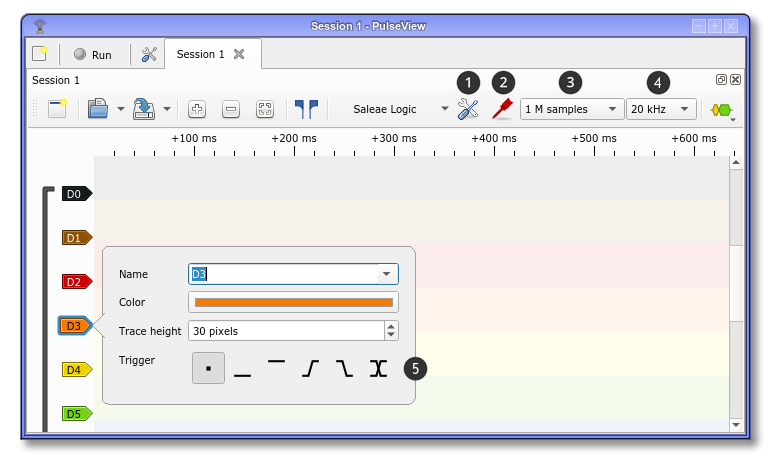
| 1 | Device-specific settings |
| 2 | Channel-specific settings |
| 3 | Number of samples to capture |
| 4 | Sample rate at which to capture the samples |
| 5 | Per-channel trigger setting (see below) |
The values offered for those four elements depend on your device. Which settings you should choose depends on several factors: the needs of your measurement, the device you use to capture the data and the capabilities of your computer.
The sample rate you choose must at least be twice that of the highest frequency you want to capture - ideally 3 to 5 times as much so that you have some margin. That way, a jittering signal won’t ruin your measurements.
| If you’re using a device with a Cypress FX2 (most 8 channel / 24 MHz logic analyzers do) then you should be aware that the 24 MHz sampling rate (12 MHz for 16 channels) can only be sustained under perfect conditions. Usually, those devices are shipped with low-quality USB cables, impairing USB transfers as USB traffic increases. Therefore, you can try a different USB cable if you’re facing issues at higher sample rates. If they persist, it’s worth trying a different USB port as well. |
4.3. Triggers
The signal labels on the left side of the view (D0, D1 and so on in the picture above) allow you to configure certain aspects of these signals. If the device supports it then the trigger that will be used for this signal will be among them.
As of now, the trigger system is awaiting extension for advanced and complex trigger types, meaning that the only triggers available to you are:
-
Trigger when the signal has a "low" level
-
Trigger when the signal has a "high" level
-
Trigger when the signal switches from "low" to "high" level (rising edge)
-
Trigger when the signal switches from "hig" to "low" level (falling edge)
-
Trigger when the signal changes level in any way (any edge)
Once you choose a trigger, the icon for the type you chose becomes visible on the right side of the trace view.
When you click "Run" with a trigger configured, PulseView will wait for the device to trigger and send data before it can show anything. There is currently no frame limit, so if the device driver supports it, PulseView will continue arming the trigger and collecting data until you either click "Stop" or it runs out of memory.
4.4. Channel Groups
Some devices share certain settings between a group of channels, which is why PulseView may show the channels your device offers in groups. You can see which channels are grouped by looking at the dark gray bar on the left. If there is none, no channels are grouped.
Currently, the grouping is only done for your convenience and there’s no direct functional impact. This means that you’re free to ungroup and group channels as you please. To do so, right-click on the dark gray bar and select "Ungroup". If you want to create a new group, select the signals you want to group by holding down CTRL and clicking on the signal labels. Once you have selected the ones you want to be grouped, right-click on one of the labels you selected and choose "Group".
5. Data Analysis
Once you have acquired some measurement data, it’s time to have a look and see what insights you can gain from it. Usually, the first step is to look at the data as a whole, achieved by clicking the Zoom to Fit button:
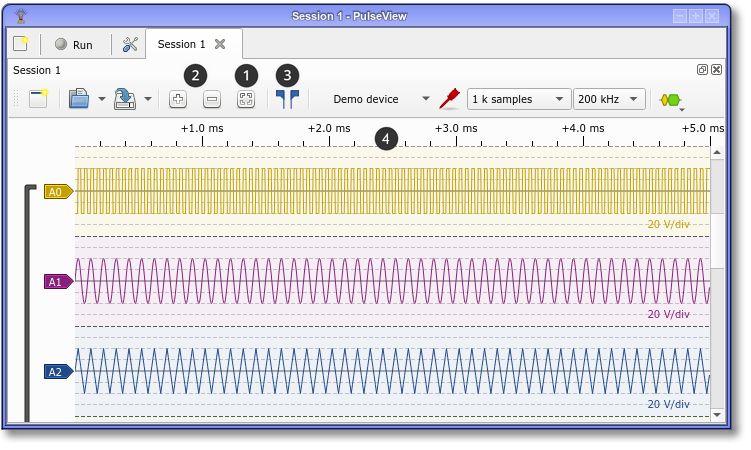
| 1 | Zoom-to-Fit button |
| 2 | Zoom in/zoom out buttons |
| 3 | Cursors |
| 4 | Time scale (used to set up and show markers, see below) |
If you have located an area of interest (maybe with the help of decoders, more about that later), you can zoom in on it using the zoom in/zoom out buttons, using the scroll wheel of your mouse or the pinch/expand gestures on your touch panel.
| When a data capture is ongoing, the Zoom-to-Fit button stays active if you click it, meaning that PulseView automatically fits all data to the views until either the capture is finished or the Zoom-to-Fit button is clicked again. If you want this feature but don’t want to always have to click the button, you can enable the "Always Zoom-to-Fit" option in the settings. |
5.1. Cursors and Markers
Just looking at the signal data however is usually not sufficient. A lot of times, you’ll want to make sure that timings are honored and the bit times are like what you’d expect. To do so, you’ll want to use cursors and markers.
In the picture above, you can enable the cursor by clicking on the cursor button. You can move both of its boundaries around by clicking on the blue flags in the time scale area. The area between the two boundary lines shows the time distance and its inverse (i.e. the frequency). If you can’t see it, just zoom in until it shows. You can also move both boundaries at the same time by dragging the label where this information is shown.
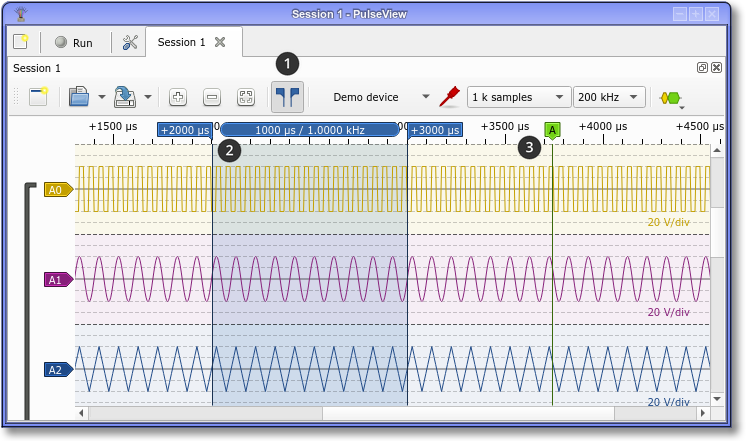
| 1 | Cursors button, showing enabled state |
| 2 | Cursor |
| 3 | Marker |
Markers are movable indicators that you can create wherever you like on the time scale - just double-click on it and it’ll create one for you where your mouse cursor is at the time, or use the context menu when right-clicking on the ruler or a signal trace. You can click on its label and you’ll have the option to change its name, or drag it to reposition it.
| For timing comparison purposes, you can also enable a vertical marker line that follows your mouse cursor: Settings → Views → Highlight mouse cursor |
| There is also a special kind of marker that appears for each time the data acquisition device has triggered. It cannot be moved and appears as a vertical dashed line. |
5.2. Special-Purpose Decoders
There are some decoders available that analyze the data instead of decoding it. You can make use of them to examine various properties of the signals that are of interest to you.
Their names are:
-
Counter - counts pulses and/or groups of pulses (i.e. words)
-
Guess bitrate - guesses the bitrate when using a serial protocol
-
Jitter - determines the jitter (variance) of a signal
-
Timing - shows the time passing between the chosen signal edges
5.3. Other Features
Trace Views also allow you to maximize the viewing area by minimizing the area occupied by the label area on the left. To do this, simply position the mouse cursor at the right edge of the label area (or left edge of the viewing area). Your mouse cursor will change shape and you now can drag the border.
This way, you can give signals long, expressive names without clogging up the view area.
Also, you can create multiple views by clicking on the "New View" button on the very left of the toolbar. Those can be rearranged as you wish.
6. Decoders
Protocol decoders are one of the key elements of PulseView’s functionality. They take input data that you acquired and process it in a way that results in a (hopefully) much easier to understand representation of that same data.
In its simplest form, a protocol decoder (PD) converts a group of 1-bit signals into a stream of n-bit events. This is exactly what the parallel PD does: it takes for example 8 logic channels and treats them like an 8-bit parallel bus, emitting annotations that show the current state of the bus at any point in time.
6.1. Basic Operation
Another one of the protocol decoders available to you is the I²C decoder. It takes the two I²C signals SCL and SDA (serial clock / serial data) and shows you the details of the I²C communication without the need to evaluate the signal bit by bit yourself.
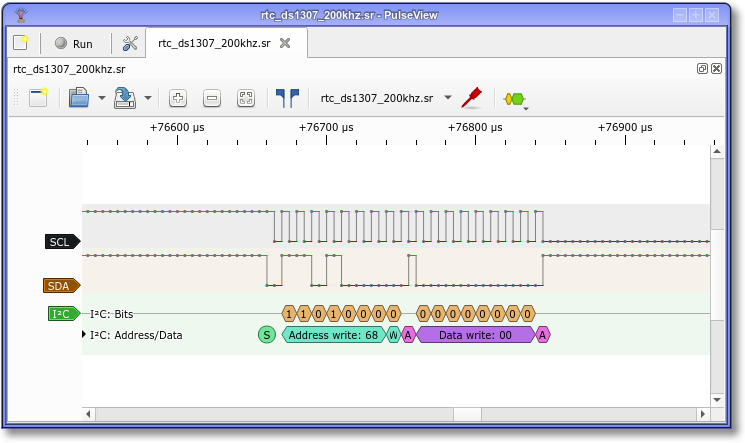
As an example, let’s have look at one of the sample .sr files we keep around for validation of the PD code base: rtc_ds1307_200khz.sr. It contains the capture of an I²C master interacting with a Dallas DS1307 I²C Real-Time Clock where the master repeatedly sets and queries the time of day. After loading and using "zoom-to-fit", it looks similar to this:
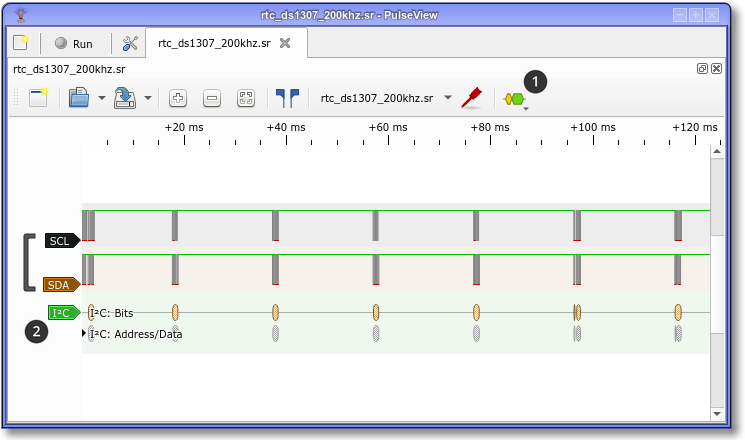
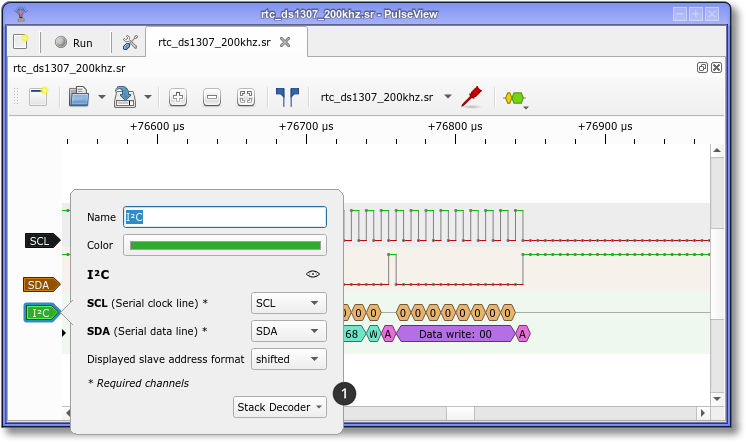
Adding the I²C decoder by clicking on ➊ and selecting I²C from the list adds a new decode signal to the view. PulseView tries to match existing signals to the signals that the newly added protocol decoder needs to function, which is what happened here - SCL and SDA have been automatically assigned and the PD has decoded the communication with the default parameters. If you need to change the signal assignment or change the decoding parameters, you can click on ➋ to do so.
When you zoom in, you now see that PulseView has decoded the I²C messages and displays these annotations as part of the decode signal (note that we have zoomed in so far that PulseView shows you the individual samples):
This is already very useful, and a massive improvement over counting out pulses on an oscilloscope screen. However, sigrok allows us to go one step further with the use of so-called stacked decoders.
6.2. Decoder Stacking
To add a stacked decoder we open the settings of the decode signal, go to the Stack Decoder menu ➊, and select the DS1307 decoder:
With the stacked decoder added, we can now see that PulseView has decoded the meaning of the I²C commands, so that we don’t need to bother searching the reference manual. In this view, we can see that the I²C packet was a command to read the date and time, which was then reported to be 10.03.2013 23:35:30.
There are all kinds of stacked decoders available, but keep in mind that they’re not shown in the decoder menu. Stacked decoders require a lower-level decoder first before they become stackable. Most of the time, they require either the UART, I²C or SPI decoder.
You can check the List of Protocol Decoders to see which protocol decoders have been created already.
6.3. Using Decoders on Analog Signals
If you’re capturing data using an oscilloscope or import analog signal data from a file, you’ll quickly notice that protocol decoders don’t give you the option to select analog channels as inputs. That is because as of now, decoders only work on logic signals. You can however convert analog signals into logic signals by choosing a conversion setting from the signal setting popup.
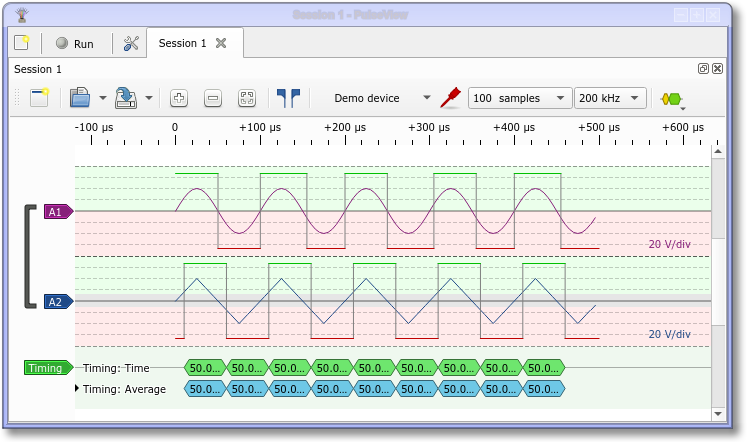
Here, A1 has been converted using a threshold (with default settings) and A2 has been converted using a Schmitt-Trigger emulation (also with default settings). Additionally, the conversion threshold display mode has been set to Background in the Views settings dialog. This way, you can tell how PulseView decided to change the logic signal level as you can now visually understand where the ranges for high and low are placed.
Aside from the default conversion threshold(s), you can choose from a few common presets or enter custom values as well. They take the form "0.0V" and "0.0V/0.0V", respectively.
6.4. Troubleshooting
In case a protocol decoder doesn’t provide the expected result, there are several things you can check.
The first check you should perform is whether the time unit in the ruler is given as "sa". This is short for "samples" and means that the device didn’t provide a sample rate and so PulseView has no way of showing a time scale in seconds or fractions thereof. While some decoders can run without timing information, or only optionally make use of the time scale, others may not be able to interpret the input data since timing information is an essential part of the very protocol.
Another issue to remain aware of is that decoders need enough samples per protocol step to reliably interpret the information. In typical cases the minimum sample rate should be four to five times the rate of the fastest activity in the protocol.
If a protocol decoder runs but shows you annotations that don’t seem to make any sense, it’s worth double-checking the decoder settings. One common source of error is the baud rate. For example, the CAN protocol decoder doesn’t know what baud rate is used on the bus that you captured, so it could be that a different baud rate is used than the one you set. Also, if this is still not the reason for the malfunction, it’s worth checking whether any of the signals have been captured inverted. Again using the CAN bus as an example, the decoder will decode the signal just fine if it’s inverted but it’ll show data even when the signal looks "idle".
When a protocol decoder stops execution because of an unmet constraint (required input not connected, essential parameter not specified) or a bug in the decoder itself, you will be presented a static red message in the protocol decoder’s display area. In that case, you check the log output in the settings menu. There you’ll find the Python error description which you can use to either adjust the configuration, or debug the decoder (and let us know of the fix) or you can copy that information and file a bug report so that we can fix it.
Further helpful knowledge and explanations on logic analyzers can be found in our "Learn about logic analyzers" FAQ item.
6.5. Exporting Annotations
If you want to postprocess annotations that were generated by a protocol decoder, you can do so by right-clicking into the area of the decode signal (not on the signal label on the left). You are shown several export methods to choose from, with the last one being only available if the cursor is enabled.
After you chose a method that suits your needs, you are prompted for a file to export the annotations to. The contents of the file very much depend on the option you chose but also on the annotation export format string that you can define in the Decoders menu of the settings dialog. If the default output isn’t useful to you, you can customize it there.
6.6. Creating a Protocol Decoder
Protocol decoders are written in Python and can be created using nothing more than a text editor. You, too, can write one!
To find out how to go about it, please see our Protocol Decoder How-To and the Protocol Decoder API Reference.
If you do write one, we’d appreciate if you’d contribute to our project so that everyone can benefit from your work.
7. Data Import/Export
In order to facilitate versatile use of the sigrok suite, libsigrok allows users to import and export data from files in various formats - some of them as generic as possible, others very specific. For a list and details, make sure to check the wiki.
7.1. Import
The first step to importing data from a file is to know what format the data in the file is encoded in. There are common, not-so-common and outright exotic ways to represent data and sigrok tries to suit as many needs as it can. To see which formats your version of PulseView supports, just click on the small arrow next to the Open button:
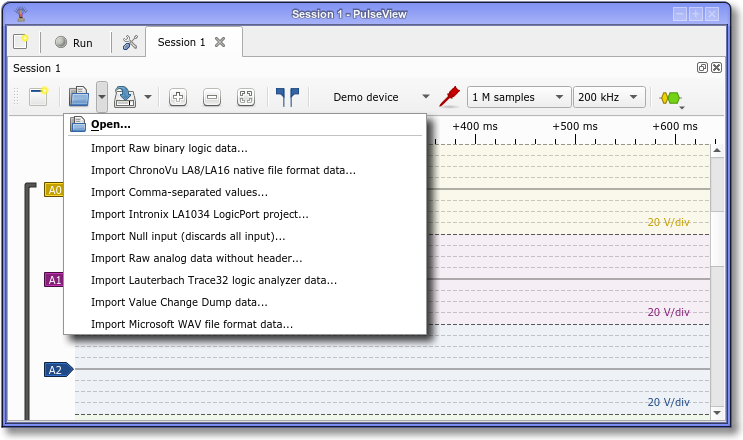
After choosing the format that you want to use, PulseView will ask for the file name to open. Once you picked the file, you may be asked to specify the details of the format, if the input module requires them.
For example, the VCD import will ask you for these:
-
Compress idle periods: Compress idle periods longer than the specified value (default 0)
-
Downsampling factor: Downsample, i.e. divide the samplerate by the specified factor (default 1)
-
Number of logic channels: The number of (logic) channels in the data (default 0)
-
Skip samples until timestamp: Skip samples until the specified timestamp; < 0: Skip until first timestamp listed; 0: Don’t skip (default -1)
The detailed description of each item can also be seen when clicking on the help icon on the right or hovering your mouse over it. A click on OK then loads the data from the selected file and you can work with it.
7.2. Export
Export works just the same as the import: clicking on the small arrow next to the Save button brings up the export menu. Simply choose the format you want to use and proceed.
8. Command-line Interface
Even though PulseView has a graphical user interface, there is also a command-line interface that you can make use of. It is meant to provide functions for convenience and debug purposes, not to replace the user interface itself.
Running
pulseview -h
gives you a list of these functions.
Since PulseView can’t automatically scan for devices connected to a COM port (ttySx on Linux) or Ethernet, you can tell it to look for a specific device using the -d or --driver parameter. Its usage is the same as for sigrok-cli. For example:
pulseview -d lecroy-xstream:conn=vxi/192.168.178.20/111
Also, just as with sigrok-cli, you can specify -i / --input-file and -I / --input-format to open a file on startup. Without -I, it is assumed that the file is in the native sigrok format (.sr). You can also specify more than one file but they are all expected to be in the same format then. Example:
pulseview -i data.csv -I csv:samplerate=3000000
The remaining parameters are mostly for debug purposes:
-V / --version		Shows the release version
-l / --loglevel		Sets the libsigrok/libsigrokdecode log level (max is 5)
-D / --dont-scan	Don't auto-scan for devices
-c / --clean		Don't restore previous sessions on startup
Of these, -D / --dont-scan can be useful when PulseView gets stuck during the startup device scan. No such scan will be performed then, allowing the program to start up but you’ll have to scan for your acquisition device(s) manually before you can use them.
Another potentially useful option is -c / --clean, which can be used when PulseView doesn’t start up and you don’t know what could cause this.
Thus, the combination of both parameters can be seen as some kind of "safe mode" for PulseView:
pulseview -c -D